Tips and cases of use for a successful WordPress website with calculated forms.
Categories: API & Services Integration, Calculated Field Operations
Generating charts in the form dynamically (Line chart, Bar chart, Pie chart, Donut chart, and the rest of charts supported by ChartJS) with the fields' values.
The Developer and Platinum versions of the "Calculated Fields Form" plugin include a new operations module: the Chart.js to plot data as charts in the form. The "Chart.js Module" includes CFFCHART operation that works as proxy for the Chartjs library.
The CFFCHART(id, options) operation, requires two parameters, the id of the canvas tag where the chart would be plotted, and a plain object to define the datasets and chart settings. These are exactly the same attributes required by the Chart function in the ChartJS API
The integration can be scary, however, I'll try to describe the process with some practical examples:
The first step in the process would be to insert in the form the canvas tag where plotting the chart. Inserts a "HTML Content" field in the form, and enter the canvas tag as its content, but don't forget to define an id attribute in the with an unique id:
<canvas id="my-chart"></canvas>
Note, if you read the API documentation, it describes how to include the API scripts in the page, but that is unnecessary with our plugin, because the CFFCHART imports the scripts by itself.
For the rest of the process I'll assume there are two fields in the form you want to plot in the chart: fieldname1 and fieldname2, with the labels: "Label A" and "Label B"
Inserts a calculated field in the form, and uses the CFFCHART operation in its equation:
    CFFCHART(
        'my-chart',
        {
            type:'bar',
            data:{
                labels:['Label A', 'Label B'],
                    datasets:[
                        {
                            label:'Comparing Fields Values',
                            data:[fieldname1, fieldname2]
                        }
                    ]
            }
        }
    )
The first parameter of the of the CFFCHART operation is the id of the canvas tag inserted into the "HMTL Content" field. And the second parameter define the chart appearance and values. I'll includes the generated chart before describing every parameter:
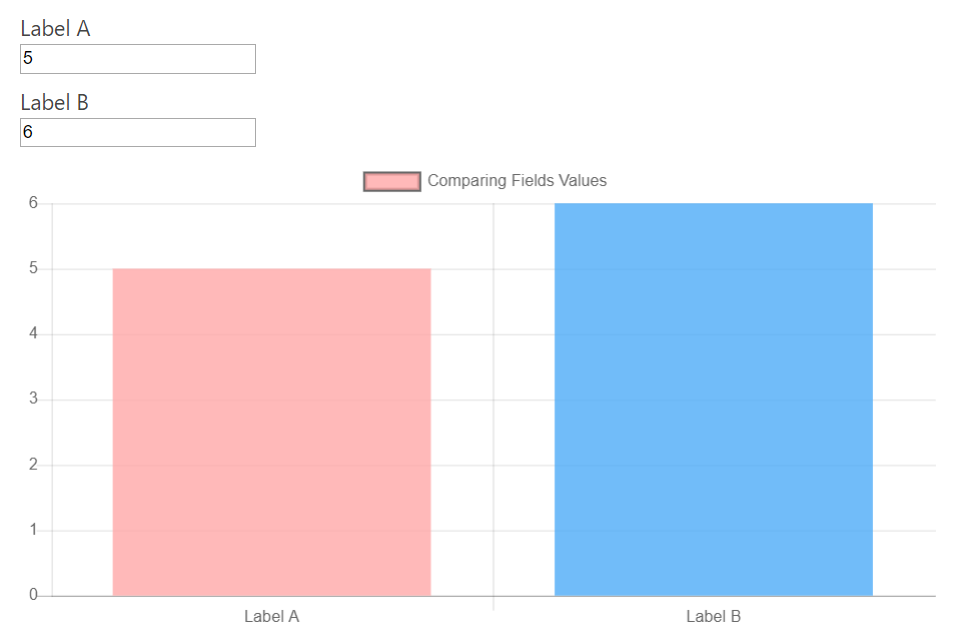
The type variable determines the chart to be generated, in this case a bar chart, however ChartJS accepts many other options.
type:'bar',
The data variable is another object, that defines the information to include in the chart.
The labels variable is an array with the values of X axis
labels:['Label A', 'Label B'],
The datasets variable is an array of objects to describe the series of data to plot, every series includes the label variable that identifies it, and would be displayed at top of chart.
label:'Comparing Fields Values',
and the data variable is the array of data to plot. In the previous example, the data are associated to the fields, in the form:
data:[fieldname1, fieldname2]
Every time the fields: fieldname1 and fieldname2 vary their values, the chart would be updated.
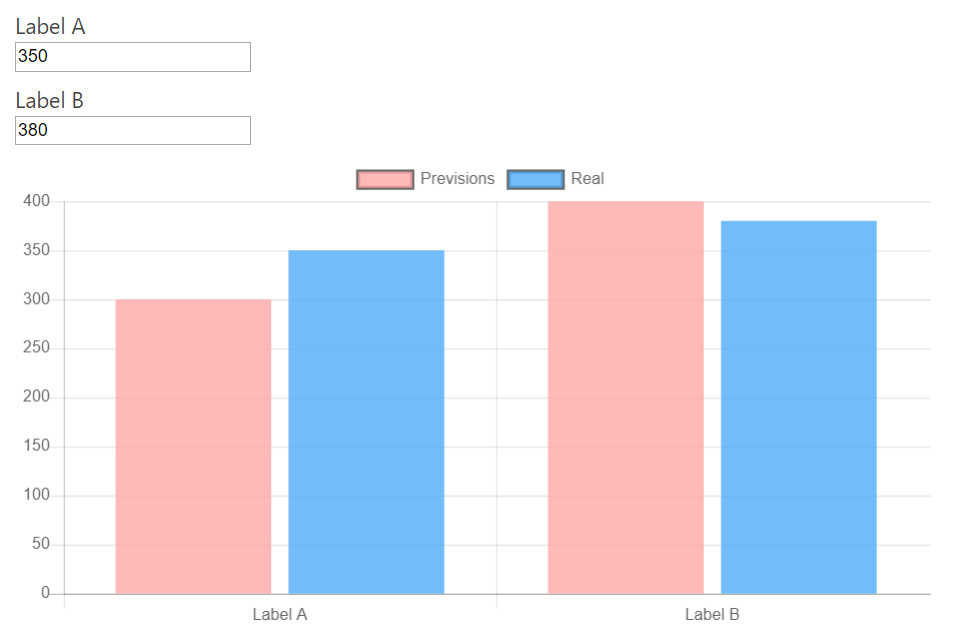
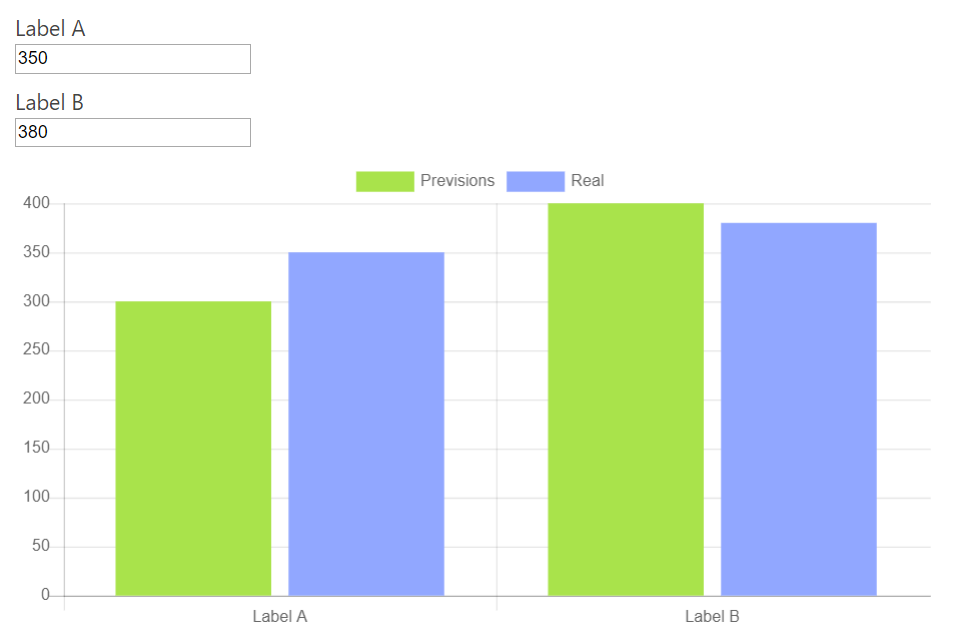
The next chart is similar to the previous one, but with two datasets, for example, for comparing previsions with reals:
    CFFCHART(
        'my-chart',
        {
            type:'bar',
            data:{
                labels:['Label A', 'Label B'],
                    datasets:[
                        {
                            label:'Previsions',
                            data:[300, 400]
                        },
                        {
                            label:'Real',
                            data:[fieldname1, fieldname2]
                        }
                    ]
            }
        }
    )
Now the datasets array includes two elements, one of them with label:'Previsions', and the second one with label:'Real',
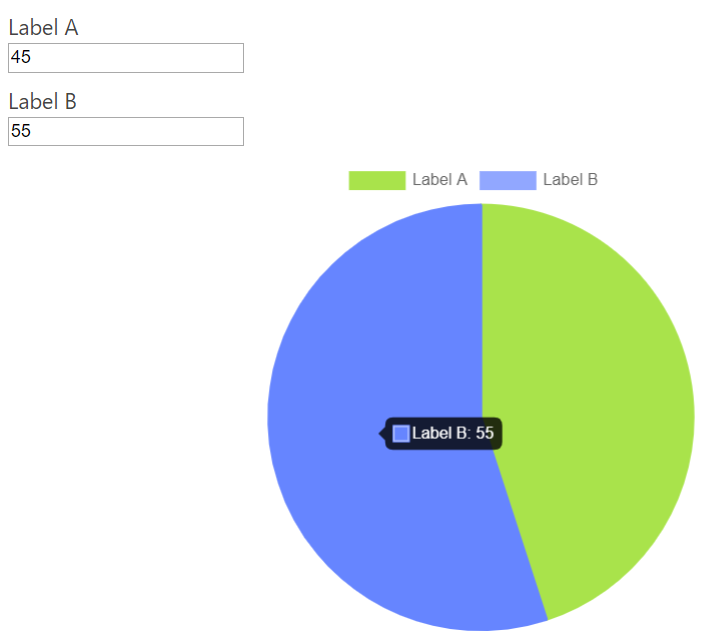
Coming back to the original demo, but this time I'm representing the data with a Pie Chart
    CFFCHART(
        'my-chart',
        {
            type:'pie',
            data:{
                labels:['Label A', 'Label B'],
                    datasets:[
                        {
                            label:'Comparing Fields Values',
                            data:[fieldname1, fieldname2]
                        }
                    ]
            }
        }
    )
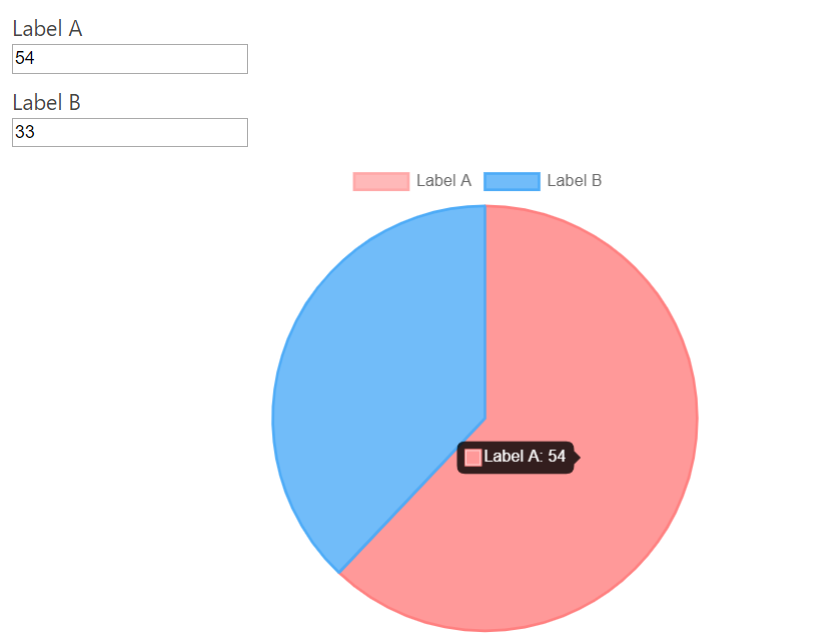
As you can see, there is only one difference between both blocks of code, in this case the type variable is set to pie
type:'pie',
The ChartJS library includes many other options and settings you can read in the ChartJS Library page.
Note: The second parameter accepts the version attribute to decide the ChartJS API version to use. Ex:
CFFCHART('canvas_id', {version:'3.7.1', type:'bar', data:{labels:['Label A', 'Label B'], datasets:[{data:[fieldname1, fieldname2]}]}});
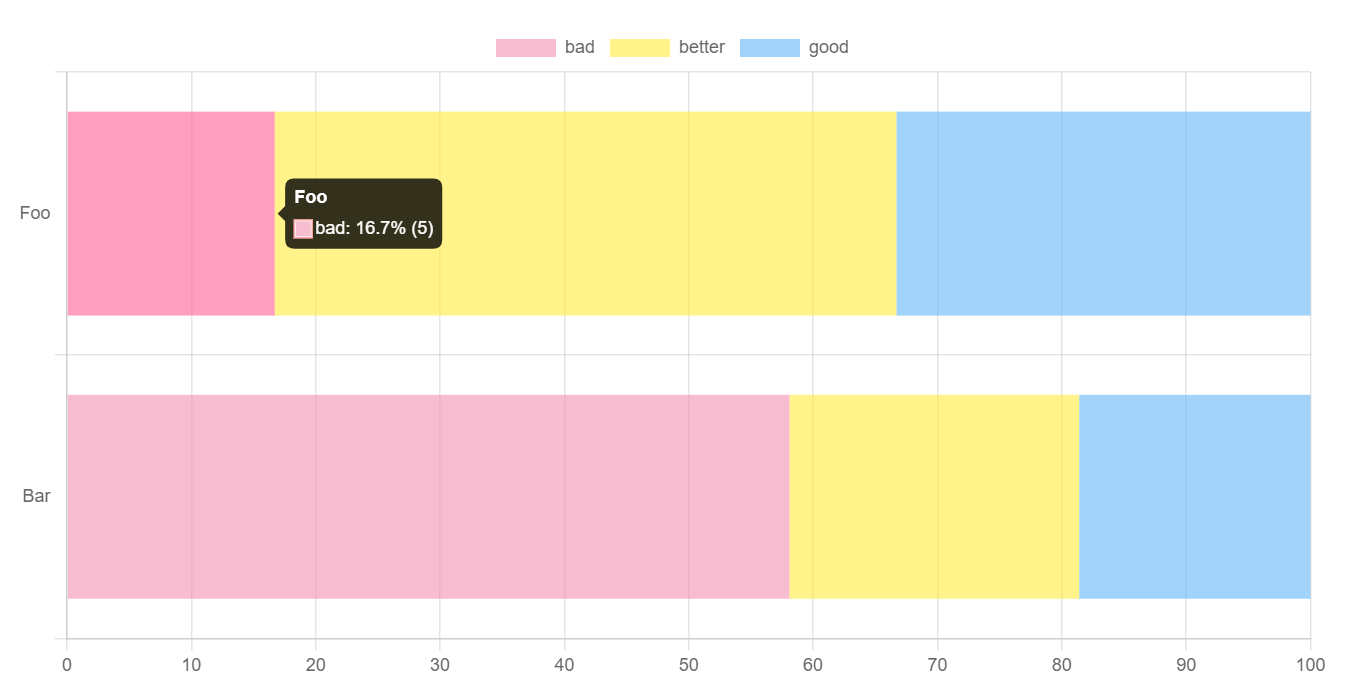
It is possible to register ChartJS plugins by passing an objects list with the plugins' URLs and a callback function to call after loading the plugin:
CFFCHART("my-chart", {
    type: "bar",
    data: {
        labels: ["Foo", "Bar"],
        datasets: [{
                label: "bad",
                data: [5, 25],
                backgroundColor: "rgba(244, 143, 177, 0.6)"
            }, {
                label: "better",
                data: [15, 10],
                backgroundColor: "rgba(255, 235, 59, 0.6)"
            }, {
                label: "good",
                data: [10, 8],
                backgroundColor: "rgba(100, 181, 246, 0.6)"
            },
        ],
    },
    options: {
        indexAxis: "y",
        plugins: {
            stacked100: {
                enable: true
            },
            "datalabels" : false
        },
    },
    register_plugins:[
        {
            "url":"https://cdn.jsdelivr.net/npm/chartjs-plugin-stacked100@1.0.0",
            "callback":function(){Chart.register(ChartjsPluginStacked100.default);}
        }
    ]
});
The CFFCHART operation selects the chart's colors by you, but, in case you want to use your own colors, it is possible define them as part of datasets:
    CFFCHART(
        'my-chart',
        {
            type:'pie',
            data:{
                labels:['Label A', 'Label B'],
                    datasets:[
                        {
                            label:'Comparing Fields Values',
                            data:[fieldname1, fieldname2],
                            borderColor:['#a9e34b', '#91a7ff'],
                            backgroundColor:['#a9e34b', '#91a7ff']
                        }
                    ]
            }
        }
    )
Pay attention to the variables: borderColor and backgroundColor in the datasets item.
In case the chart includes multiple series:
    CFFCHART(
        'my-chart',
        {
            type:'bar',
            data:{
                labels:['Label A', 'Label B'],
                    datasets:[
                        {
                            backgroundColor:'#a9e34b',
                        borderColor: '#a9e34b',
                            label:'Previsions',
                            data:[300, 400]
                        },
                        {
                            backgroundColor:'#91a7ff',
                        borderColor: '#91a7ff',
                            label:'Real',
                            data:[fieldname1, fieldname2]
                        }
                    ]
            }
        }
    )
One of most common use of chart is plotting currency values, but the values associated to the charts must be valid numbers. So, what would be the solution? The alternative would be to format the values before display them in the tooltips.
        CFFCHART(
            'my-chart',
            {
                type: 'pie',
                data: {
                    labels: ['Label A', 'Label B'],
                    datasets: [
                        {
                            label: 'Comparing Fields Values',
                            data: [fieldname1, fieldname2]
                        }
                    ]
                },
                options: {
                    tooltips: {
                        callbacks : {
                            label: function(tooltipItem, data) {
                                return '  $'+data['datasets'][0]['data'][tooltipItem['index']].toString().replace(/\B(?=(\d{3})+(?!\d))/g, ",");
                            }
                        }
                    }
                }
            }
        )
With the latest versions of the ChartJS API, the equivalent code would be:
        CFFCHART(
            'my-chart',
            {
                type: 'pie',
                data: {
                    labels: ['Label A', 'Label B'],
                    datasets: [
                        {
                            label: 'Comparing Fields Values',
                            data: [fieldname1, fieldname2]
                        }
                    ]
                },
                options: {
                    plugins:{
                        tooltip: {
                            callbacks: {
                                label: function (context) {
                                    return context.label+':  $' + context.parsed.toString().replace(/\B(?=(\d{3})+(?!\d))/g, ",");
                                }
                            }
                        }
                    }
                }
            }
        )
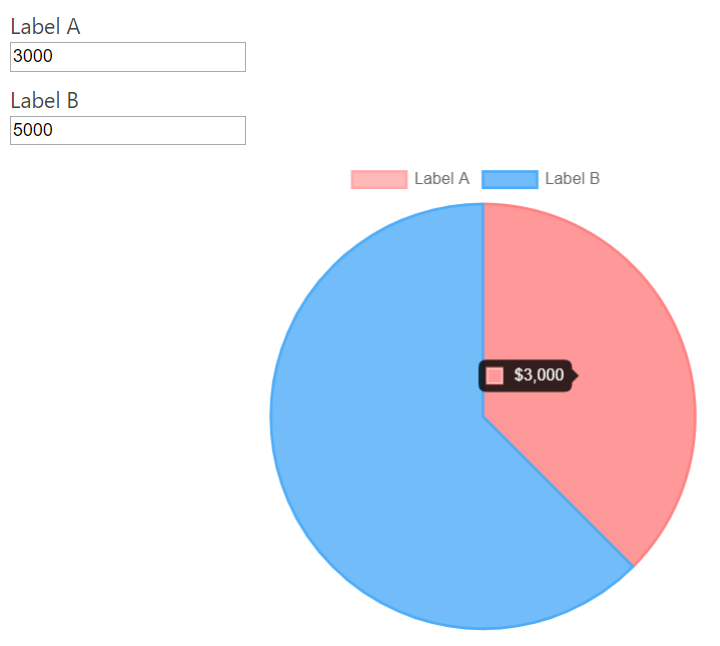
Pay attention to the callback function in the tooltips variable of options variable.
More details in the ChartJS library website.
